Monitoring your linux system is one of the main roles played by the administrators in their day-to-day life. Though linux is equipped with many monitoring tools that provide us many options to monitor the system the way we want it to. We will discuss few that are largely used, easy to remember and use. These tools can be built-in commands or programs and add-on tools.
Monitoring any system includes cpu usage, process activity, memory consumption, storage (disk) usage, network statistics and many more. These all criteria can be observed through command line and also there are a few graphical tools that can be useful too. We will first of all go through the built-in commands and tools that can help us in monitoring the linux machine.
Monitoring CPU
Using Sysstat
You need to install this package from the ubuntu repository.
$ sudo apt-get install sysstat
After which we can do deep monitoring of cpu using mpstat command.
$ mpstat
This command helps in monitoring smp box where multiple cpu are present We can use mpstat to display individual cpu utilization.
The command mpstat displays the average activities of all present processors.

$ mpstat -P ALL
This will display all the processors present in the system with their invidual stats.
On my laptop
baban@hashprompt:~$ mpstat -P ALL
Linux 3.2.0-35-generic (hashprompt) Sunday 20 January 2013 _x86_64_ (4 CPU)
12:20:19 IST CPU %usr %nice %sys %iowait %irq %soft %steal %guest %idle
12:20:19 IST all 5.09 0.01 3.47 1.41 0.00 0.03 0.00 0.00 89.99
12:20:19 IST 0 6.44 0.01 3.41 2.01 0.00 0.12 0.00 0.00 88.01
12:20:19 IST 1 4.09 0.01 3.43 2.24 0.00 0.02 0.00 0.00 90.22
12:20:19 IST 2 6.55 0.00 3.25 0.93 0.00 0.00 0.00 0.00 89.27
12:20:19 IST 3 3.29 0.00 3.79 0.49 0.00 0.00 0.00 0.00 92.44
baban@hashprompt:~$
On SMP box
HPC2:~ # mpstat -P ALL
Linux 2.6.16.60-0.35-default (HPC2) Sunday 20 January 2013
01:14:19 IST CPU %user %nice %sys %iowait %irq %soft %steal %idle intr/s
01:14:19 IST all 27.25 0.00 4.28 3.11 0.01 0.04 0.00 65.31 33521.58
01:14:19 IST 0 57.27 0.00 16.10 0.11 0.00 0.00 0.00 26.52 251.21
01:14:19 IST 1 61.99 0.00 21.39 0.09 0.00 0.00 0.00 16.53 250.30
01:14:19 IST 2 20.57 0.00 0.47 3.25 0.00 0.00 0.00 75.71 255.70
01:14:19 IST 3 14.18 0.00 0.30 2.35 0.00 0.00 0.00 83.17 264.58
01:14:19 IST 4 19.85 0.00 0.48 4.35 0.00 0.00 0.00 75.32 255.94
01:14:19 IST 5 19.73 0.00 0.52 4.44 0.00 0.00 0.00 75.31 252.76
01:14:19 IST 6 18.51 0.00 0.42 4.35 0.00 0.00 0.00 76.71 252.80
01:14:19 IST 7 17.23 0.00 0.46 4.41 0.00 0.00 0.00 77.90 253.14
01:14:19 IST 8 15.15 0.00 0.25 0.52 0.00 0.00 0.00 84.08 285.23
01:14:19 IST 9 11.64 0.00 0.17 0.69 0.00 0.00 0.00 87.49 256.51
01:14:19 IST 10 60.21 0.00 21.76 0.10 0.00 0.00 0.00 17.93 250.22
01:14:19 IST 11 51.33 0.00 20.29 0.53 0.00 0.00 0.00 27.85 250.50
01:14:19 IST 12 29.35 0.00 7.06 4.45 0.00 0.00 0.00 59.14 253.43
01:14:19 IST 13 18.03 0.00 1.25 4.46 0.00 0.00 0.00 76.26 252.86
01:14:19 IST 14 17.11 0.00 1.84 4.52 0.00 0.00 0.00 76.53 252.98
01:14:19 IST 15 19.60 0.00 1.92 4.49 0.00 0.00 0.00 73.99 253.35
01:14:19 IST 16 21.50 0.00 0.54 4.23 0.00 0.00 0.00 73.73 255.17
01:14:19 IST 17 24.73 0.00 0.46 4.20 0.00 0.00 0.00 70.61 253.58
01:14:19 IST 18 21.40 0.00 0.42 4.24 0.00 0.00 0.00 73.94 254.26
01:14:19 IST 19 18.53 0.00 0.43 4.42 0.00 0.00 0.00 76.62 254.53
01:14:19 IST 20 24.57 0.00 0.47 4.15 0.00 0.00 0.00 70.81 253.20
01:14:19 IST 21 19.74 0.00 0.46 3.91 0.00 0.00 0.00 75.90 252.75
01:14:19 IST 22 21.53 0.00 0.46 4.00 0.00 0.00 0.00 74.01 252.93
01:14:19 IST 23 18.15 0.00 0.55 4.18 0.00 0.00 0.00 77.13 257.21
01:14:19 IST 24 22.35 0.00 0.58 2.84 0.00 0.00 0.00 74.23 257.91
01:14:19 IST 25 23.74 0.00 0.52 2.79 0.00 0.00 0.00 72.95 252.30
01:14:19 IST 26 23.79 0.00 0.44 2.69 0.00 0.00 0.00 73.08 253.89
01:14:19 IST 27 27.48 0.00 0.44 2.74 0.00 0.00 0.00 69.34 254.86
-----output truncated-----
Using SAR (System Activity Recorder)
To make the sysstat utility to collect system activity information we have to edit the file /etc/default/sysstat and set the option "ENABLED" as "true". Refer the below screenshot for more details.

$ sar -u

$ sar -u 2 5

$ sar -u -P ALL

%user - Percentage of CPU utilization that occurred while executing at the user level (application).
%nice - Percentage of CPU utilization that occurred while executing at the user level with nice priority.
%system - Percentage of CPU utilization that occurred while executing at the system level (kernel).
%iowait - Percentage of time that the CPU or CPUs were idle during which the system had an outstanding disk I/O request.
%steal - Percentage of time spent in involuntary wait by the virtual CPU or CPUs while the hypervisor was servicing another virtual processor.
%idle - Percentage of time that the CPU or CPUs were idle and the system did not have an outstanding disk I/O request.
Using iostat
$ sudo iostat -xtc

Using vmstat
$ sudo vmstat 2 5

Monitoring Memory
Using /proc/meminfo
The /proc/meminfo file stores memory usage statistics.
 The above shown screenshot is the truncated output. As you can see that the total memory of my laptop is 3838124kB. Below calculation shall give us the the total memory used.
Mem Used = MemTotal - MemFree - Buffers - Cached
 As you can see both the outputs are same.
Using free
$ free -m
 free -m command shows memory utilization in MB. Here, 1364MB is the actual used memory whereas 2383MB is the actual free memory.
$ free -m -t
This command displays the total memory present, utilized and free respectively which includes the swap memory also.

Using vmstat
$ vmstat 2 5

Using top
$ top

Using SAR

Monitoring Processes
Using Top
Top is a program that provides the real-time dynamic view of running system. By default it displays the cpu intensive processes that are ordered by highest percentage of CPU usage on the top. The top area contains the uptime, load average, no of users and processes and memory consumption.
 Few hot-keys that have various usages in top are listed below.
1 - Displays the cpu states of multiple numbers processors present in the system.
A - Displays the top resource hungry processes
k - to kill a particular PID
z - to choose between colour and mono
Using ps
ps is another built-in command which is very useful to monitor processes. It displays the snapshot of the running processes at particular instance of time the command is run. Below mentioned are few common examples of ps command.
$ ps -ejH
This command helps to view the process hierarchy.
PID PGID SID TTY TIME CMD
933 933 933 ? 00:00:00 bluetoothd
934 930 930 ? 00:00:03 rsyslogd
938 938 938 ? 00:00:03 NetworkManager
2235 2235 938 ? 00:00:00 dhclient
2348 2348 938 ? 00:00:00 dnsmasq
965 903 903 ? 00:00:13 polkitd
969 968 968 ? 00:00:00 avahi-daemon
972 968 968 ? 00:00:00 avahi-daemon
990 990 990 ? 00:00:00 cupsd
2543 2543 2543 tty7 01:15:55 Xorg
2641 1092 1092 ? 00:00:00 lightdm
2731 2731 2731 ? 00:00:00 gnome-session
2766 2766 2766 ? 00:00:00 ssh-agent
2783 2731 2731 ? 00:00:13 gnome-settings-
2822 2731 2731 ? 00:00:10 syndaemon
2814 2731 2731 ? 00:10:33 cinnamon
3034 2731 2731 ? 00:00:12 nemo
3099 2731 2731 ? 00:00:02 /usr/bin/termin
3109 2731 2731 ? 00:00:00 /usr/bin/termin <defunct>
3110 3110 3110 pts/0 00:00:00 bash
3166 3166 3110 pts/0 00:00:00 sudo
3176 3166 3110 pts/0 00:02:05 vmware
3797 2731 2731 ? 00:11:35 chromium-browse
3815 2731 2731 ? 00:00:11 chromium-browse
3921 2731 2731 ? 00:00:08 chromium-browse
9084 2731 2731 ? 00:09:58 chromium-browse
10311 2731 2731 ? 00:00:18 chromium-browse
22853 2731 2731 ? 00:00:06 /usr/bin/termin
22864 2731 2731 ? 00:00:00 /usr/bin/termin <defunct>
22865 22865 22865 pts/2 00:00:00 bash
23495 23495 22865 pts/2 00:00:00 ps
2844 2731 2731 ? 00:00:00 nm-applet
2848 2731 2731 ? 00:00:00 polkit-gnome-au
2852 2731 2731 ? 00:00:00 gnome-fallback-
3029 2731 2731 ? 00:00:00 gdu-notificatio
3063 2731 2731 ? 00:00:01 zeitgeist-datah
3064 2731 2731 ? 00:00:01 gnome-screensav
1106 1106 1106 ? 00:00:03 irqbalance
1278 1278 1278 ? 00:00:00 vmware-vmblock-

$ ps -Al
Shows long output of all processes.

$ ps -AlF
Shows long with some extra full output.

$ ps ax
Prints all processes

$ ps aux

pgrep & ps -p
Displays only the process id(s) associated with the process.

pmap -d
Reports memory map of a process.

Using pidstat
Lists all running processes and the resources that they are using.

Pidstat can be used with options like -u (CPU utilization) and -r (memory utilization) with time intervals.

System Running Status
Using uptime
uptime gives you the duration for which the server has been up and running, number of users logged into the system and the load averages for the past 1min, 5mins and 15mins respectively.
$ uptime

User Stats
Using w
w command lists the users currently logged into the system and the processes they are using.
$ w

We can also list the processes used by particular user.
$ w baban

NFS Statistics
$ nfsstat
Lists NFS statistics. To run this command we need to install the nfs-common package using below command.
$ sudo apt-get install nfs-common

Other Tools
Using Gnome System Monitor
Gnome System Monitor tool is the best graphical monitor tool that comes with the Ubuntu operating system. This tool is very helpful in monitoring CPU, Memory & swap, Network, Processes and File Systems.

Using atop
This command is similar to top command. atop also displays used and free memory like top but differs only in some advanced options. atop does not come bundled with the os. It has to be installed from the ubuntu repository using the below mentioned command.
$ sudo apt-get install atop
$ atop


Using Glances
Glances is another free monitoring tool like top/htop which can be used through text interface. It is developed in python. The most unique thing in this software is that this software can determine the status of system resources on the system and can indicate the status in various colors which helps in easy monitoring. Also there is a provision to set the threshold values for the indicators.
This software is maintained by Nicolargo. You can download software and easy step-by-step instructions for installation can be found at github.
Below shown is a screenshot of Glances on my system.

Using GKrellM
GKrellM is a GTK-based stacked monitor program that charts SMP CPUs, memory, swap, disks, load, active net interfaces and internet connections.
It can be installed using the below mentioned command.
$ sudo apt-get install gkrellm

There are also various exciting skins available at muhri.net. You can download the tarball of all skins from here. Extract the tarball using below command.
$ sudo tar -xzvf GKrellM-Skins.tar.gz
After extraction you will find many skins in tar.gz format. To extract all .tar.gz files run the below command.
$ for i in *.tar.gz; do tar -xzvf $i; done
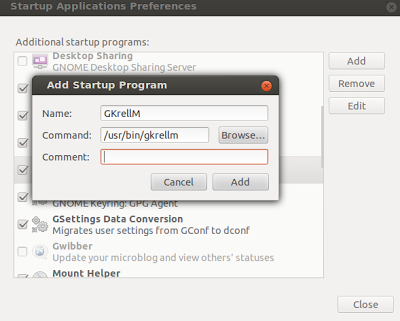
Now move all the extracted skin directories to themes directory inside .gkrellm2 directory of your home directory. To auto-start it you can add it to "Startup Applications". See the below screenshot for more details.
My system has got GKrellM with invisible skin. Heres what it looks like...

Using Munin
Munin is a graphical monitoring tool for both network and system which presents its output as graph through a web interface.

Installation and configuration of munin can be found here.
Using Conky
It's a light-weight system monitor for X window system. Conky scripts are available for almost all desktop environments like Unity, Gnome, Mate, Cinnamon, etc. You can download the script and edit it as per your requirements. I too have a conky running on cinnamon desktop shown below.

There are lots of conky scripts all over the internet. I had some scripts from this noobslab website.
Note: Please feel free to share any other commands and tools that I have missed.
Monitoring any system includes cpu usage, process activity, memory consumption, storage (disk) usage, network statistics and many more. These all criteria can be observed through command line and also there are a few graphical tools that can be useful too. We will first of all go through the built-in commands and tools that can help us in monitoring the linux machine.
Monitoring CPU
Using Sysstat
You need to install this package from the ubuntu repository.
$ sudo apt-get install sysstat
After which we can do deep monitoring of cpu using mpstat command.
$ mpstat
This command helps in monitoring smp box where multiple cpu are present We can use mpstat to display individual cpu utilization.
The command mpstat displays the average activities of all present processors.

$ mpstat -P ALL
This will display all the processors present in the system with their invidual stats.
On my laptop
baban@hashprompt:~$ mpstat -P ALL
Linux 3.2.0-35-generic (hashprompt) Sunday 20 January 2013 _x86_64_ (4 CPU)
12:20:19 IST CPU %usr %nice %sys %iowait %irq %soft %steal %guest %idle
12:20:19 IST all 5.09 0.01 3.47 1.41 0.00 0.03 0.00 0.00 89.99
12:20:19 IST 0 6.44 0.01 3.41 2.01 0.00 0.12 0.00 0.00 88.01
12:20:19 IST 1 4.09 0.01 3.43 2.24 0.00 0.02 0.00 0.00 90.22
12:20:19 IST 2 6.55 0.00 3.25 0.93 0.00 0.00 0.00 0.00 89.27
12:20:19 IST 3 3.29 0.00 3.79 0.49 0.00 0.00 0.00 0.00 92.44
baban@hashprompt:~$
On SMP box
HPC2:~ # mpstat -P ALL
Linux 2.6.16.60-0.35-default (HPC2) Sunday 20 January 2013
01:14:19 IST CPU %user %nice %sys %iowait %irq %soft %steal %idle intr/s
01:14:19 IST all 27.25 0.00 4.28 3.11 0.01 0.04 0.00 65.31 33521.58
01:14:19 IST 0 57.27 0.00 16.10 0.11 0.00 0.00 0.00 26.52 251.21
01:14:19 IST 1 61.99 0.00 21.39 0.09 0.00 0.00 0.00 16.53 250.30
01:14:19 IST 2 20.57 0.00 0.47 3.25 0.00 0.00 0.00 75.71 255.70
01:14:19 IST 3 14.18 0.00 0.30 2.35 0.00 0.00 0.00 83.17 264.58
01:14:19 IST 4 19.85 0.00 0.48 4.35 0.00 0.00 0.00 75.32 255.94
01:14:19 IST 5 19.73 0.00 0.52 4.44 0.00 0.00 0.00 75.31 252.76
01:14:19 IST 6 18.51 0.00 0.42 4.35 0.00 0.00 0.00 76.71 252.80
01:14:19 IST 7 17.23 0.00 0.46 4.41 0.00 0.00 0.00 77.90 253.14
01:14:19 IST 8 15.15 0.00 0.25 0.52 0.00 0.00 0.00 84.08 285.23
01:14:19 IST 9 11.64 0.00 0.17 0.69 0.00 0.00 0.00 87.49 256.51
01:14:19 IST 10 60.21 0.00 21.76 0.10 0.00 0.00 0.00 17.93 250.22
01:14:19 IST 11 51.33 0.00 20.29 0.53 0.00 0.00 0.00 27.85 250.50
01:14:19 IST 12 29.35 0.00 7.06 4.45 0.00 0.00 0.00 59.14 253.43
01:14:19 IST 13 18.03 0.00 1.25 4.46 0.00 0.00 0.00 76.26 252.86
01:14:19 IST 14 17.11 0.00 1.84 4.52 0.00 0.00 0.00 76.53 252.98
01:14:19 IST 15 19.60 0.00 1.92 4.49 0.00 0.00 0.00 73.99 253.35
01:14:19 IST 16 21.50 0.00 0.54 4.23 0.00 0.00 0.00 73.73 255.17
01:14:19 IST 17 24.73 0.00 0.46 4.20 0.00 0.00 0.00 70.61 253.58
01:14:19 IST 18 21.40 0.00 0.42 4.24 0.00 0.00 0.00 73.94 254.26
01:14:19 IST 19 18.53 0.00 0.43 4.42 0.00 0.00 0.00 76.62 254.53
01:14:19 IST 20 24.57 0.00 0.47 4.15 0.00 0.00 0.00 70.81 253.20
01:14:19 IST 21 19.74 0.00 0.46 3.91 0.00 0.00 0.00 75.90 252.75
01:14:19 IST 22 21.53 0.00 0.46 4.00 0.00 0.00 0.00 74.01 252.93
01:14:19 IST 23 18.15 0.00 0.55 4.18 0.00 0.00 0.00 77.13 257.21
01:14:19 IST 24 22.35 0.00 0.58 2.84 0.00 0.00 0.00 74.23 257.91
01:14:19 IST 25 23.74 0.00 0.52 2.79 0.00 0.00 0.00 72.95 252.30
01:14:19 IST 26 23.79 0.00 0.44 2.69 0.00 0.00 0.00 73.08 253.89
01:14:19 IST 27 27.48 0.00 0.44 2.74 0.00 0.00 0.00 69.34 254.86
-----output truncated-----
Using SAR (System Activity Recorder)
To make the sysstat utility to collect system activity information we have to edit the file /etc/default/sysstat and set the option "ENABLED" as "true". Refer the below screenshot for more details.

$ sar -u

$ sar -u 2 5

$ sar -u -P ALL

%user - Percentage of CPU utilization that occurred while executing at the user level (application).
%nice - Percentage of CPU utilization that occurred while executing at the user level with nice priority.
%system - Percentage of CPU utilization that occurred while executing at the system level (kernel).
%iowait - Percentage of time that the CPU or CPUs were idle during which the system had an outstanding disk I/O request.
%steal - Percentage of time spent in involuntary wait by the virtual CPU or CPUs while the hypervisor was servicing another virtual processor.
%idle - Percentage of time that the CPU or CPUs were idle and the system did not have an outstanding disk I/O request.
Using iostat
$ sudo iostat -xtc

Using vmstat
$ sudo vmstat 2 5

Monitoring Memory
Using /proc/meminfo
The /proc/meminfo file stores memory usage statistics.

Mem Used = MemTotal - MemFree - Buffers - Cached
= 1434868kB
We can compare and verify this output with the gnome-system-monitor ouput.
Using free
$ free -m

$ free -m -t
This command displays the total memory present, utilized and free respectively which includes the swap memory also.

Using vmstat
$ vmstat 2 5

Using top
$ top

Using SAR
$ sar -r 2 5

The above command also helps to calculate the exact memory utilization in ubuntu.
Monitoring Processes
Using Top
Top is a program that provides the real-time dynamic view of running system. By default it displays the cpu intensive processes that are ordered by highest percentage of CPU usage on the top. The top area contains the uptime, load average, no of users and processes and memory consumption.

1 - Displays the cpu states of multiple numbers processors present in the system.
A - Displays the top resource hungry processes
k - to kill a particular PID
z - to choose between colour and mono
Using ps
ps is another built-in command which is very useful to monitor processes. It displays the snapshot of the running processes at particular instance of time the command is run. Below mentioned are few common examples of ps command.
$ ps -ejH
This command helps to view the process hierarchy.
PID PGID SID TTY TIME CMD
933 933 933 ? 00:00:00 bluetoothd
934 930 930 ? 00:00:03 rsyslogd
938 938 938 ? 00:00:03 NetworkManager
2235 2235 938 ? 00:00:00 dhclient
2348 2348 938 ? 00:00:00 dnsmasq
965 903 903 ? 00:00:13 polkitd
969 968 968 ? 00:00:00 avahi-daemon
972 968 968 ? 00:00:00 avahi-daemon
990 990 990 ? 00:00:00 cupsd
2543 2543 2543 tty7 01:15:55 Xorg
2641 1092 1092 ? 00:00:00 lightdm
2731 2731 2731 ? 00:00:00 gnome-session
2766 2766 2766 ? 00:00:00 ssh-agent
2783 2731 2731 ? 00:00:13 gnome-settings-
2822 2731 2731 ? 00:00:10 syndaemon
2814 2731 2731 ? 00:10:33 cinnamon
3034 2731 2731 ? 00:00:12 nemo
3099 2731 2731 ? 00:00:02 /usr/bin/termin
3109 2731 2731 ? 00:00:00 /usr/bin/termin <defunct>
3110 3110 3110 pts/0 00:00:00 bash
3166 3166 3110 pts/0 00:00:00 sudo
3176 3166 3110 pts/0 00:02:05 vmware
3797 2731 2731 ? 00:11:35 chromium-browse
3815 2731 2731 ? 00:00:11 chromium-browse
3921 2731 2731 ? 00:00:08 chromium-browse
9084 2731 2731 ? 00:09:58 chromium-browse
10311 2731 2731 ? 00:00:18 chromium-browse
22853 2731 2731 ? 00:00:06 /usr/bin/termin
22864 2731 2731 ? 00:00:00 /usr/bin/termin <defunct>
22865 22865 22865 pts/2 00:00:00 bash
23495 23495 22865 pts/2 00:00:00 ps
2844 2731 2731 ? 00:00:00 nm-applet
2848 2731 2731 ? 00:00:00 polkit-gnome-au
2852 2731 2731 ? 00:00:00 gnome-fallback-
3029 2731 2731 ? 00:00:00 gdu-notificatio
3063 2731 2731 ? 00:00:01 zeitgeist-datah
3064 2731 2731 ? 00:00:01 gnome-screensav
1106 1106 1106 ? 00:00:03 irqbalance
1278 1278 1278 ? 00:00:00 vmware-vmblock-
----- Output truncated -----
$ pstree
Shows the process hierarchy.
Shows the process hierarchy.

$ ps -Al
Shows long output of all processes.

$ ps -AlF
Shows long with some extra full output.

$ ps ax
Prints all processes

$ ps aux

pgrep & ps -p
Displays only the process id(s) associated with the process.

pmap -d
Reports memory map of a process.

Using pidstat
Lists all running processes and the resources that they are using.

Pidstat can be used with options like -u (CPU utilization) and -r (memory utilization) with time intervals.

System Running Status
Using uptime
uptime gives you the duration for which the server has been up and running, number of users logged into the system and the load averages for the past 1min, 5mins and 15mins respectively.
$ uptime
Using w
w command lists the users currently logged into the system and the processes they are using.
$ w
We can also list the processes used by particular user.
$ w baban
NFS Statistics
$ nfsstat
Lists NFS statistics. To run this command we need to install the nfs-common package using below command.
$ sudo apt-get install nfs-common

Other Tools
Using Gnome System Monitor
Gnome System Monitor tool is the best graphical monitor tool that comes with the Ubuntu operating system. This tool is very helpful in monitoring CPU, Memory & swap, Network, Processes and File Systems.

This command is similar to top command. atop also displays used and free memory like top but differs only in some advanced options. atop does not come bundled with the os. It has to be installed from the ubuntu repository using the below mentioned command.
$ sudo apt-get install atop
$ atop

Using htop
htop is also a similar process as top and atop. It is very interactive as it gives a dynamic graphical representation of cpu utilization, memory and swap usage.
$ sudo apt-get install htop
$ htop

Using Glances
Glances is another free monitoring tool like top/htop which can be used through text interface. It is developed in python. The most unique thing in this software is that this software can determine the status of system resources on the system and can indicate the status in various colors which helps in easy monitoring. Also there is a provision to set the threshold values for the indicators.
This software is maintained by Nicolargo. You can download software and easy step-by-step instructions for installation can be found at github.
Below shown is a screenshot of Glances on my system.

Using GKrellM
GKrellM is a GTK-based stacked monitor program that charts SMP CPUs, memory, swap, disks, load, active net interfaces and internet connections.
It can be installed using the below mentioned command.
$ sudo apt-get install gkrellm

There are also various exciting skins available at muhri.net. You can download the tarball of all skins from here. Extract the tarball using below command.
$ sudo tar -xzvf GKrellM-Skins.tar.gz
After extraction you will find many skins in tar.gz format. To extract all .tar.gz files run the below command.
$ for i in *.tar.gz; do tar -xzvf $i; done
Now move all the extracted skin directories to themes directory inside .gkrellm2 directory of your home directory. To auto-start it you can add it to "Startup Applications". See the below screenshot for more details.

My system has got GKrellM with invisible skin. Heres what it looks like...

Using Munin
Munin is a graphical monitoring tool for both network and system which presents its output as graph through a web interface.

Installation and configuration of munin can be found here.
Using Conky
It's a light-weight system monitor for X window system. Conky scripts are available for almost all desktop environments like Unity, Gnome, Mate, Cinnamon, etc. You can download the script and edit it as per your requirements. I too have a conky running on cinnamon desktop shown below.

There are lots of conky scripts all over the internet. I had some scripts from this noobslab website.
Note: Please feel free to share any other commands and tools that I have missed.
No comments:
Post a Comment